CategoriesNews

Future of the Exurbs: Will Prices in Outer Suburbs Stay High—or Fall?

The COVID-19 pandemic turned the real estate market inside out, as the big cities swiftly lost their megawatt appeal—with their home prices and rents plummeting accordingly—while the farthest-out, sleepiest suburbs suddenly became new hot spots for homebuyers.

The exurbs, as these outer suburbs are called, experienced the highest price growth over the past year, according to Realtor.com®. While suburbs closer to the urban core remained the most popular with buyers, exurbs saw the biggest increase in interest from home shoppers.

That surge was driven by the fear of COVID-19, the rise of remote work, and the search for more affordable homes with enough square footage in which to quarantine with the whole family. Builders have also been putting up new homes in these areas, where land is cheaper and more plentiful.

However, the future of the exurbs in a post-pandemic world remains uncertain. Many workers will eventually have to return to their offices, even if it’s just a few days a week, making the issue of a commute relevant once more. Plus, exurbs have historically been more vulnerable to downturns—they were hammered in the Great Recession. Fears of a bubble, however unlikely, could give buyers pause.

These areas could find themselves competing with the appeal of urban life again. Big cities became more attractive as vaccines became available and businesses and entertainment venues reopened their doors.

However, the emergence of the delta variant could complicate things further.

“The jury is still out,” says Realtor.com Chief Economist Danielle Hale. “It’s possible that some areas that saw prices rise because they were particularly attractive during the pandemic might not be able to sustain those high prices. … The factors that drew people to those areas, like having a lot of space and being far away from everything else, may change.”

Will home prices in the exurbs eventually fall?

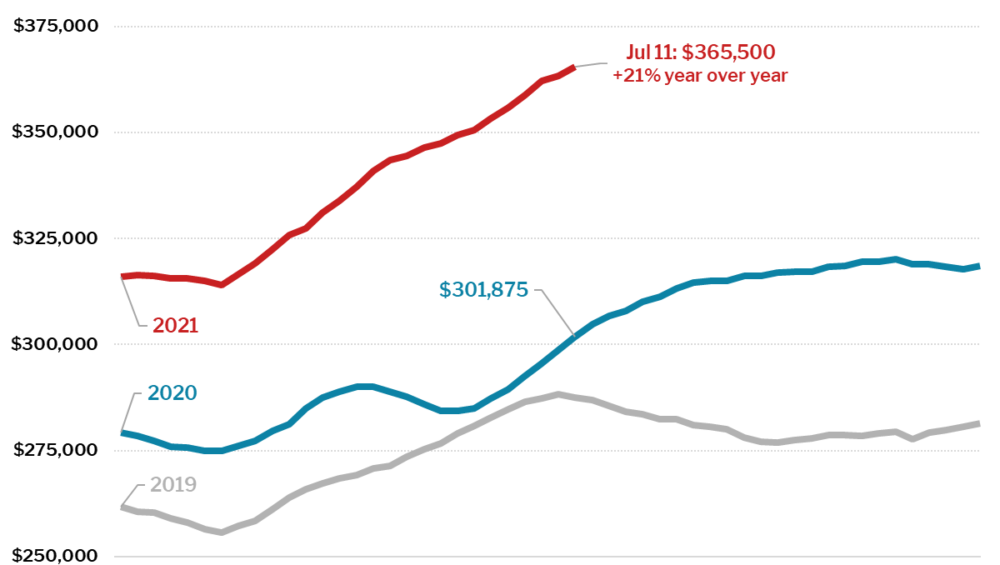
Prices have grown the most in the exurbs during the pandemic. Depicted above are exurban ZIP Codes in the 100 largest metropolitan areas with enough listings to derive meaningful trends. (Sabrina Speianu/Realtor.com)

The big question for many is whether prices in the exurbs will continue to go up—or if they’ll decline. Since buying a home is the largest investment most people will ever make, most buyers want to be as sure as they can that the value of that investment won’t go down.

The shortage of homes for sale and higher prices in the closer-in suburbs and cities may continue to force aspiring homeowners on a budget and struggling renters to move farther out to find more affordable housing. That demand could keep prices in the exurbs from falling.

“The desire for affordability, which is only going to become more important as interest rates go up, is going to keep interest in the suburbs and outer suburbs high. They have always been the escape valve for high city prices,” says Hale.

“It’s not a new phenomenon that, when people can’t afford the city, they look further out,” she continues.

The potential staying power of the work-from-home phenomenon will also likely prevent prices from slipping too much. If workers can go entirely remote or commute only once or twice a week, they may be more likely to seek out cheaper real estate in a more bucolic setting.

“I don’t think prices will drop off dramatically,” says Kelly Mangold, who specializes in real estate economics at the consulting firm RCLCO. “Everyone’s not going back to the office five days a week anytime soon.”

Investors, who typically seek out cheaper housing they can buy and flip or rent out, may also give these areas a boost.

“We’ll still see healthy price appreciation,” says Devyn Bachman, vice president of research at John Burns Real Estate Consulting. Or in certain areas that experienced rapid price hikes, “you may see small corrections in these markets.”

On the flip side, more square footage and larger backyards require more maintenance, and many cash-strapped buyers may not want to pay to have all that grass mowed or the snow shoveled. It’s also more expensive to heat a 3,000-square-foot home than one half the size.

Higher mortgage interest rates could also hurt prices in the exurbs. Rates fell below 3% for an average 30-year fixed-rate mortgage during the pandemic. This made ultrahigh prices more palatable, because the lower rates offset some of the higher costs, helping monthly mortgage payments stay affordable. If rates rise, home prices won’t have the same room to rise. They could even dip in the places that experienced the biggest run-up in prices.

“The mortgage payment becomes very high,” says Ali Wolf, chief economist of building consultancy Zonda. “There are locals who will just get crushed.”

But housing experts don’t expect a full-blown crash even if prices do correct a bit. There is more demand for housing than there are homes available—the opposite of what happened in the mid-2000s. And unlike in the last real estate bubble, only the most qualified borrowers are being approved for mortgages, lessening the chances of another foreclosure crisis.

Builders are putting up more homes in the exurbs

The thing about remote suburbs is that they have potential for development—and builders have taken notice. There’s more land available for building in these areas.

Roughly 9.2% of construction on single-family homes was in the exurbs of large metropolitan areas in the second quarter of 2021, according to the National Association of Home Builders. That’s in addition to the 8.9% of construction in the outer suburbs of medium-sized metropolitan areas.

“Exurbs have great potential for development,” says Realtor.com’s Hale. “They have more open space for builders to build and create things, which is a bit harder to come by the closer in you get to the city.”

Putting up more homes brings in new residents, which attracts more grocery stores, shops, restaurants, and entertainment. These amenities in turn make these communities more desirable and could keep the housing markets in these areas strong, unless the supply of homes outstrips the demand for them.

But overbuilding doesn’t seem too likely. Builders have a lot of catching up to do to meet demand, and they’ve  been skittish since the last real estate bust.

“Builders are skeptical about how much this may last and are being more conservative about shifting their pipeline in that direction,” says Hale.

Origination: https://www.realtor.com/news/trends/future-of-the-exurbs-where-prices-jumped-during-pandemic/


CategoriesNews

Character Meets Comfort In Upper West Side Prewar Conversions

Prewar. The very word conjures images of the elegance and grace of an earlier, more refined and less cynical time. When employed to describe buildings, the term is most often used to denote the charming, sophisticated but all-too rare pre-1941 residential structures of Manhattan, many of them sprinkling the storied Upper West Side. 

Even more, limited in number are prewar conversions, which offer the aesthetics of their earlier epochs but also incorporate amenities demanded by today’s discerning buyers. The developers of these conversions have updated the layouts, ensuring they remain true to the buildings’ historic essence, while delivering a more open and functional flow.

It’s no surprise UWS prewar conversions like Astor, 378 West End Avenue and the recently unveiled Marlow are increasingly sought by buyers who relish history and tradition as much as the creature comforts of today’s newer ground-up developments.

Redesigning prewars for contemporary lifestyles requires of architects a balancing act of sorts. When designing contemporary luxury residences in prewar buildings, architects must comprehend the “bones” of the buildings. Prewars possess charm, architectural grace, scale and an emphasis on room-making. The result is well-proportioned space imbued with intimacy and character. Architects try to keep what makes each prewar structure special, while re-interpreting the building for modern living, says Julie Nelson, partner at BKSK Architects, the firm responsible for Marlow.

The Astor, 235 West 75th Street

Delivering Gilded Age glamor for a new generation in the heart of the Upper West Side, The Astor is being called one of the most celebrated landmarked condominiums in New York City real estate history. Renowned for its trademark trio of towers on Broadway between 75th and 76th Streets, The Astor represented the epitome of luxury when it debuted around the turn of the century. Recently restored by design firm Pembrooke & Ives, it marries classic architectural style with the most modern of features and finishes.

378 West End Avenue

Positioned on the Upper West Side’s grand residential boulevard, this is a time-honored and intriguing condominium located steps from Riverside Park. COOKFOX handled design both inside and out, while Alchemy Properties developed the property. Among its most arresting features are unobstructed views over landmarked buildings, a generous share of social, fitness and wellness amenities and elegant residences blending prewar space with the abundant natural light and contemporary design of modern buildings.

Marlow, 150 West 82nd Street

Developed by Slate Property Group and BentallGreenOak, designed by BKSK Architects and featuring a model unit decorated by Nate Berkus and Jeremiah Brent, Marlow is a 10-story, 27-residence building with homes that range from studios to four-bedroom penthouse duplexes.

The 1926 building delivers a broad array of sizes and floor plans, and such features as prewar beamed ceilings soaring to nine feet, with Windsor Pinnacle series double-hung windows and walk-in closets throughout.

The kitchens are distinguished by custom white oak cabinetry with lacquered white bronze detailing, a specialty etched glass backsplash and Kohler brushed brass finishes. Prices start in the high $600,000s. Outside, some of the Upper West Side’s most appealing attractions, including Central Park, high-end restaurants, cafes, music venues and landmarks, all are easily accessible to building residents.

“This pre-war conversion building has a completely different appeal opposed to ground-up, new development,” says Shaun Osher, CEO of CORE, the boutique brokerage that is the exclusive sales team for Marlow. CORE launched sales this summer.

“It incorporates the best of both worlds. The Marlow encapsulates history, charm and architectural integrity while boasting sophisticated, modern-day finishes, layouts and amenities buyers are seeking. There is an increased demand for residences that offer exclusivity, outdoor space and the convenience of a condo unit that has the feel of a single-family home, which is exactly what Marlow delivers.”

Origination: https://www.forbes.com/sites/jeffsteele/2021/08/18/character-meets-comfort-in-uws-prewar-conversions/?ss=real-estate&sh=4622b7bf742a 


CategoriesNews

Understanding The Record Absorption Of Manhattan’s New Development

New York City’s new development sales market has rebounded fast and furiously, quieting naysayers who lamented that the city was doomed for a slow and painful recovery. In contrast, our firm’s data show that Manhattan’s 2021 new development sales market posted 980 new contracts signed through June 30, 2021, a 34% increase over the same time period in 2019. Further, by our calculation of the current pace — 163 units per month, on average — the Manhattan new development market is poised to absorb approximately 1,960 new development units in 2021.

So, to what can we attribute this impressive rebound from a once-in-a-lifetime event? 

  • Pent-up demand: As savvy buyers believed the market to have bottomed out, many began their search for a new home or investment property in the third quarter of 2019 and into early 2020. Those buyers did their homework, shopped online and attended virtual tours seeking out the perfect opportunity. Now, as vaccine efficacy became apparent and a new administration took over to implement its distribution, buyers realized that the window of opportunity for slightly lower prices and choice of inventory would be short-lived. They took advantage of this in ready-to-move-in new developments offering concessions such as up to 10 years of free common charges. These perks primed the pump for a quick recovery.
  • Covid cabin fever: Looking at the same four walls for a year created a yearning for new beginnings, more space, outdoor space and views. This helped build demand for new development. Buyers began to realize that their current residences did not meet their needs. With historically low interest rates, a healthy supply of new, ready-to-move-in product and demand growing for re-sale residences, upgrading for that extra bedroom, terrace or alcove was critical.
  • The suburban housing boom: With many fleeing the city as Covid-19 spread, the suburbs saw a resurgence, allowing empty-nesters in particular to sell their homes at prices far above what they could have sold for in the past five years. Many of those empty nesters chose to take advantage of the incentives and price adjustments in the Manhattan market. They scooped up trophy penthouses, pieds-a-terre, and two- to three-bedroom condos.
  • Back to school: With most Manhattan universities announcing the return to in-person classes, many parents have chosen to assist their college-age children in buying a new home by investing in Manhattan real estate rather than renting an apartment. Many of those parents expect to one day move into the city themselves, and thus their children can attend school while their equity grows. When their child moves on, the parents could plan to occupy the apartment either on a permanent or part-time basis.

Together, these four touchpoints helped make the first half of 2021 a record time for the Manhattan new development market. Low interest rates, high demand for homes convenient to work as employees begin to occupy their offices again and new jobs being added at a record pace have also led to this incredible reboot. 

As we move into the second half of 2021, we can expect demand to continue to be high as the foreign investor market is showing signs of heating up and as the market begins to reach equilibrium between seller and buyer. New York City has long proven to bounce back beyond expectations after significant events, and the same is holding true through Covid-19.

Origination: https://www.forbes.com/sites/forbesrealestatecouncil/2021/08/02/understanding-the-record-absorption-of-manhattans-new-development/?ss=real-estate&sh=73b584cf62e3 


CategoriesNews

Gloria Vanderbilt’s Unique Manhattan Apartment Is Listed for $1.125 Million

“Decorating is autobiography,” said Gloria Vanderbilt, the late designer, artist, and heiress whose Manhattan apartment has just been listed for sale. The home is an artifact of her keen appreciation for art and home decor and as such has largely been kept the same as it was upon her death in 2019 at the age of 95.

The building, located on Midtown East’s Beekman Place, was constructed in 1931 and was Vanderbilt’s home from 1997 to the time of her death. Her son, the CNN journalist Anderson Cooper, insisted to the New York Times that this long occupancy is a testament to her love for the place — in his childhood their family moved every four years as she’d often grow restless and want to find somewhere new.

An explosion of bright pink greets guests in the entryway. Photo: Anastassios Mentis/Brown Harris Stevens

“It’s a constant laboratory for her,” said Wendy Goodman, a friend of the multi-hyphenate and author of The World of Gloria Vanderbilt, “She’s always repainting and redecorating. It’s like a tonic for her.” The space has numerous unique design elements that would only be found in a former residence of Gloria Vanderbilt, all of which are visible in the listing photos Take, for instance, the mirrored walls, the unique light fixtures, or the mantel she hand-painted with a quote paraphrased from Albert Einstein: “The distance between past, present and future is only an illusion, however persistent.”

The socialite’s former living room. Photo: Anastassios Mentis/Brown Harris Stevens 

The 3 bedrooms 2.5 bathroom residence has been listed for $1.125 million by Ileen G. Schoenfeld and Aracely Moran of Brown Harris Stevens. The apartment has beautiful high ceilings with tasteful beams throughout, ample closet space, and natural light, though the unit has not been renovated since Vanderbilt’s arrival in 1997 and is in need of some updates. The ground floor space she used as a studio is also being considered for sale.


CategoriesNews

24% of home sellers expect to get above asking price. But how much should you offer?

It’s a seller’s market — and those who list their homes have the potential to make a lot of money.

Right now may not be a good time to buy a home. Though mortgage rates are very competitive, home prices are extremely inflated because there’s not a lot of inventory to go around.

But while today’s real estate market may be challenging for buyers, it’s great for sellers. In fact,

Some 53% of sellers expect that they’ll get their asking price once they put a home on the market, according to a recent survey by Realtor.com. But 24% expect to get above their asking price.

Why are homes selling above asking prices?

In a normal housing market, you might find the occasional bidding war, where two or more buyers duke it out over the same home, all the while raising its sale price in the process. But in today’s housing market, record low inventory is making bidding wars more of a mainstay. In fact, around 20% of sellers expect their home to wind up in a bidding war.

Not only are bidding wars driving home prices up, but many potential buyers choose to make an offer on a house that is above the seller’s asking price in an attempt to avoid a bidding war. And if you’ve been having a hard time getting an offer accepted, that’s a tactic you may want to try out, too.

Imagine a home is listed for $300,000. In a bidding war, that home price could eventually be driven up to $350,000 if competing buyers keep raising their offers by $5,000 or $10,000 increments in an effort to win.

Now, let’s say you’re interested in that $300,000 home, and you decide to make an initial offer of $320,000, or $20,000 over asking price. The seller may be so happy with that offer that they decide to accept it on the spot and put the home under contract. That could, in turn, save you money on that home — even if you do end up paying more than what the home is listed for.

In fact, some sellers in today’s market may be slightly underpricing their homes in an effort to drive a bidding war. But again, coming in with an offer above asking price could work to your benefit as a buyer.

How much should buyers offer?

Making an offer above a home’s asking price could lead to a contract. But be careful:  you don’t want to go overboard.

First of all, the higher a price you pay for your home, the higher your mortgage payments will be. Also, if the home you’re buying doesn’t appraise for its sale price, you may not be able to get the mortgage you need to finance that home.

In today’s red-hot housing market, sellers clearly have the upper hand, and their confidence is evident. Making an offer above asking price could help keep the home you want out of a bidding war. And that could, in turn, save you not only a lot of money, but a world of stress.

A historic opportunity to potentially save thousands on your mortgage

Offer from the Motley Fool: Chances are, interest rates won’t stay put at multi-decade lows for much longer. That’s why taking action today is crucial, whether you’re wanting to refinance and cut your mortgage payment or you’re ready to pull the trigger on a new home purchase. 

Our expert recommends this company to find a low rate – and in fact, he used them himself to refi (twice!). Click here to learn more and see your rate.

We’re firm believers in the Golden Rule, which is why editorial opinions are ours alone and have not been previously reviewed, approved, or endorsed by included advertisers. The Ascent does not cover all offers on the market. Editorial content from The Ascent is separate from The Motley Fool editorial content and is created by a different analyst team. The Motley Fool has a disclosure policy.

Origination: https://www.usatoday.com/story/money/personalfinance/real-estate/2021/07/01/24-percent-of-home-sellers-expect-to-get-more-than-their-asking-price/46857561/

CategoriesNews

June 2021 Existing-Home Sales Bounce Back as Home Prices Hit Second Highest Pace

NAR released a summary of existing-home sales data showing that housing market activity this June increased 1.4% from May 2021. June’s existing-home sales reached a 5.86 million seasonally adjusted annual rate, and June’s sales of existing homes increased 22.9% from June 2020.

The national median existing-home price for all housing types rose to $363,300 in June, up 23.4% percent from a year ago. Home prices have continued to rise, and this marks the 112th consecutive month of year-over-year gains.

Regionally, all four regions showed double-digit price growth from a year ago. The Northeast had the largest gain of 23.6% followed by the South with an increase of 21.4 %. The Midwest showed an increase of 18.5% and the West had the smallest price gain of 17.6% from June 2020.

June’s inventory inclined 4.1% from last month, standing at 1.26 million homes for sale and indicating some slight easing of the tight inventory condition.

However, compared with June of 2020, inventory levels are 18.2% lower. This would mark 25 straight months of year-over-year declines. It will take 2.6 months to move the current level of inventory at the current sales pace, well below the desired pace of 6 months.

Demand remains strong as home buyers are snatching listings quickly off the MLS, and it takes approximately 17 days for a home to go from listing to a contract in the current housing market. A year ago, it took 24 days.

From May 2021, all four regions had inclines in sales except the South, where sales were flat. The Midwest had the biggest gain of 3.1% followed by the Northeast with an incline of 2.8%. The West region had the smallest increase in sales of 1.7%.

From a year ago, all four regions showed double-digit inclines in sales. The Northeast region had the largest gain of 45.1% followed by the West with an incline of 23.7%. The South had an increase in sales of 19.8% followed by the Midwest with the smallest gain of 18.8%.

The South led all regions in percentage of national sales, accounting for 44.3% of the total, while the Northeast had the smallest share at 12.6%.

In June, single-family sales increased 1.4% and condominiums sales were up 1.4 compared to last month. Single-family home sales were up 19.3% while condominium sales were up 56.5% compared to a year ago, reflecting the impact of the pandemic lockdown. The median sales price of single-family homes rose to 24.4% at $370,600 from June 2020, while the median sales price of condominiums rose 19.1% at $311,600.

Origination: https://www.nar.realtor/blogs/economists-outlook/june-2021-existing-home-sales-bounce-back-as-home-prices-hit-second-highest-pace 


CategoriesNews

Share of U.S. Homes Bought in Cash Hits 30 Percent

Largest Percentage of Cash Buyers Since 2014

National property broker Redfin is reporting that nearly one-third (30%) of U.S. home purchases this year were paid for with all cash.

That’s up from 25.3% during all of 2020 and represents the largest share since 2014, when 30.6% of homes were purchased with all cash. Redfin analyzed county records published from January 2021 to April 2021.

Cash purchases are on the rise as Americans reap the benefits of a strong stock market. The S&P 500 Index has gained 36% in the past 12 months alone, as of July 14, 2021.

“I’ve never seen more cash in Boise’s housing market than I’ve seen in the past year,” said Shauna Pendleton, a Redfin real estate agent in Idaho. “I just sold a $700,000 home to a cash buyer last week. The entire $700,000 came from his E*Trade account.”

Additionally, remote work has allowed homeowners in expensive cities, including San Francisco and New York, to sell their homes and move to less expensive areas, where they can often afford to buy properties in cash.

“Affluent homeowners in Seattle, Portland, and parts of California are selling their homes for $1 million or $2 million,” Pendleton said. “Then they’re coming to Boise, where they’re buying houses that are twice the size for half the price.”

Investors, who often pay in cash, are wading back into the housing market after pressing pause at the onset of the pandemic. U.S. home purchases by investors rose 2.7% year over year in the first quarter, marking the first period of growth since the coronavirus pandemic began.

The rise in all-cash home purchases is posing challenges for many first-time and lower-income homebuyers, who are having trouble competing with cash offers. While competition is easing slightly, about two-thirds of the home offers written by Redfin agents still face bidding wars.

In Parts of Florida, More Than Half of Homes That Have Sold This Year Were Bought With Cash

In the West Palm Beach, FL metro area, 52.6% of home purchases this year were paid for with all cash. That’s the largest share of the 86 metropolitan areas in Redfin’s analysis. Metros must have had at least 3,000 recorded home sales from Jan. 1, 2021, and April 30, 2021, to be included in this report. West Palm Beach was followed by Naples, FL (52.5%), Nassau County, NY (50.2%), North Port, FL (49.4%), Port St. Lucie, FL (46.2%), Greenville, SC (45.4%), Palm Bay, FL (44.1%), Cape Coral, FL (44.1%), Des Moines, IA (41%) and Jacksonville, FL (40.1%).

“Florida is a big second-home market, and second-home buyers often pay with cash,” said Dina Blau, a Redfin real estate agent in the West Palm Beach area. “During the pandemic, folks also flocked to Florida to buy primary homes. They sold their houses in New York, New Jersey, Chicago, or California and used the proceeds to pay cash for properties in Florida.”

California Has Lowest Share of Cash Transactions

Expensive California metros, where it’s more challenging to pay with cash because home prices are relatively high, were at the bottom of the list. In both San Jose, CA and Oakland, CA, 12.5% of reported home purchases this year used all cash–the lowest share of the metros Redfin analyzed. Next came Richmond, VA (16%), Los Angeles (16%), San Diego (16.2%), Lake County, IL (17.2%), Sacramento (17.7%), San Francisco (17.8%), Oxnard, CA (18%) and Bakersfield, CA (19.3%).

Still, buyers in California aren’t out of the woods, according to Steven Moore, a Redfin real estate agent in Los Angeles.

“I recently put in a $1.8 million offer on a home that was listed at $1.7 million,” Moore said. “The top 10 offers–out of 40 total–all came in at around $2 million and were all cash.”

Origination: https://www.worldpropertyjournal.com/real-estate-news/united-states/seattle/real-estate-news-cash-home-buyer-data-for-2021-redfin-housing-reports-percentage-of-homes-purchased-in-cash-in-2021-covid-19-impact-on-real-estate-hom-12625.php

CategoriesNews

Housing Market Update: Pending Sales Dip, Price Drops Becoming More Common

Over 4% of homes for sale had price drops, and pending sales are down more than 10% from their 2021 peak.

The average weekly share of homes for sale with a price drop passed 4% for the first time since September, another signal that the hyper-competitive housing market is cooling. Other indicators corroborate the slowdown: the share of homes sold over list price, the share of homes sold within a week and median days on market are all also either cooling off or plateauing.

Pending sales were up 11% from a year ago, but down 11% from the 2021 peak, and asking prices have been relatively flat since late May. Even amid this shift, sellers remain in the driver’s seat, as home prices continued to rise more than 20% from a year ago and the number of homes for sale sits 30% below the same time last year.

Looking ahead, some indicators of early-stage homebuyer interest like tour activity, mortgage purchase applications and requests for service from Redfin agents have shown signs of picking back up. It’s too early to call it a trend, but we’ll continue to track whether this continues and leads to sales and competition heating back up.

Unless otherwise noted, the data in this report covers the four-week period ending July 11. Redfin’s housing market data goes back through 2012.

“Asking prices are still high, but the share of listings with price drops is rising steadily and could soon reach pre-pandemic levels,” said Redfin Chief Economist Daryl Fairweather. “That’s an early indication that we are past the peak for this intense seller’s market. Buyers may begin to regain some negotiating power on properties that have been on the market for more than a week.”

Key housing market takeaways for 400+ U.S. metro areas:

Data based on homes listed and/or sold during the period:

  • The median home-sale price increased 21% year over year to $365,500, a record high.
  • Asking prices of newly listed homes were up 12% from the same time a year ago to a median of $361,700. This is up 0.5% from the four-week period ending July 4, but down 0.6% from the all-time high two weeks ago.
  • Pending home sales were up 11% year over year, the smallest increase since the four-week period ending July 5, 2020. Pending sales were down 11% from their 2021 peak during the four-week period ending May 30, compared to a 4% decrease over the same period in 2019.
  • New listings of homes for sale were up 3% from a year earlier. The number of homes being listed is in a typical seasonal decline, down 8% from the 2021 peak during the four-week period ending May 23, compared to an 11% decline over the same period in 2019.
  • Active listings (the number of homes listed for sale at any point during the period) fell 30% from 2020—the smallest decline since the four-week period ending January 31—and have climbed 9% since their 2021 low during the four week period ending March 7.
  • 53% of homes that went under contract had an accepted offer within the first two weeks on the market, well above the 44% rate during the same period a year ago, but down 4.2 percentage points from the high point of the year, set during the four-week period ending March 28.
  • 38% of homes that went under contract had an accepted offer within one week of hitting the market, up from 32% during the same period a year earlier, but down 5.1 percentage points from the high point of the year, set during the four-week period ending March 28.
  • Homes that sold were on the market for a median of 15 days, an all-time low that has been flat for the last four weeks, and down from 38 days a year earlier.
  • A record 55% of homes sold above list price, up from 28% a year earlier. This measure is plateauing, having been 54-55% since the four-week period ending June 27.
  • The share of homes for sale with price drops rose to 4.1%, continuing to surpass 2020 level, and climbing closer to 2019 levels (4.7% at this time in 2019).
  • The average sale-to-list price ratio, which measures how close homes are selling to their asking prices, increased to 102.3%. In other words, the average home sold for 2.3% above its asking price. This measure is an all-time high and 3.5 percentage points higher than a year earlier, but growth has slowed and it may be at or near its peak for the year.

Other leading indicators of homebuying activity:

  • Mortgage purchase applications increased 8% week over week (seasonally adjusted) during the week ending July 9. For the week ending July 15 30-year mortgage rates fell to 2.88%, the lowest level since mid-February.
  • From January 1 to July 11, home tours went up 23%, compared to a 50% increase over the same period last year according to home tour technology company ShowingTime.
  • The seasonally adjusted Redfin Homebuyer Demand Index—a measure of requests for home tours and other services from Redfin agents—rose sharply during the week ending July 11, and is currently up 15% from a year earlier.

Refer to our metrics definition page for explanations of all the metrics used in this report.

Origination: https://www.redfin.com/news/housing-market-update-price-drops-over-4pct/ 

CategoriesNews

Penthouse ‘Crown Jewel’ in One of NYC’s Oldest Skyscrapers Hits the Market for $2M

The penthouse on top of one of New York City’s oldest skyscrapers has become available. Located in a historic Lower Manhattan building, the unit is available for $2 million.

Billed as one of New York City’s “crown jewels,” the full-floor penthouse in the landmarked Liberty Tower offers an unusual aerie, where the owner is at eye level with the ornamental decorations that adorn the exterior.

Upon its completion in 1979, the notable building was “one of only a handful of skyscrapers,” according to the New York Times. “Its striking Gothic style, the centuries-old inspiration for cathedral spires that reach into the sky to approach the divine, is central to the tower’s romantic appeal.”

Living room (Brown Harris Stevens)
Dining room (Brown Harris Stevens)
Sloped ceiling (Brown Harris Stevens)
Bedroom (Brown Harris Stevens)
Bathroom (Brown Harris Stevens)
Views with building ornaments (Brown Harris Stevens)

Now known as Liberty Tower, the Gothic Revival-style building designed by Henry Ives Cobb initially opened as office space. The law office of Franklin D. Roosevelt was one of the first tenants of the 33-floor tower in 1910. (FDR later served as president, from 1933 to 1945.)

Soon after World War I, Sinclair Oil acquired the building, and in 1979, the structure was converted into residential apartments.

Unlike many sleek monoliths of the modern era, this historic tower, with its terra-cotta facade and ornate design, has more of a Notre Dame Cathedral vibe than a typical New York City skyscraper. The exterior is decorated with birds, alligators, flowers, and gargoyles.

Designated a city landmark in 1982 and added the following year to the National Register of Historic Places, the building also received a preservation award from the New York Landmarks Conservancy in 2010.

Last sold in 2005 for $958,000, the apartment could bring quite a windfall if it sells close to its asking price. Still, as penthouses in Manhattan go, the price could be considered a relative deal. Especially from that perch overlooking the city.

“Views of the Hudson and East rivers and the Wall Street Canyon are spectacular,” says the listing agent, Richard N. Rothbloom with Brown Harris Stevens. “And at eye level, right outside each window, are large sculptures of falcons, lions, and fleurs-de-lis that decorate the top of the building.”

The top-floor unit, with two bedrooms and two bathrooms, spans the entire 32nd floor, a total of 1,700 square feet. The living space boasts a dozen windows with southern, western, and eastern exposures, under 11-foot vaulted ceilings in rooms that have the “dramatic slopes of a garret,” as the listing description puts it.

And we know why. Rothbloom notes that the top floor was “formerly the attic of landmark Liberty Tower.” That’s one fancy crawl space!

The foyer opens onto an expansive living room, featuring a wood-burning fireplace, nooks, office, and home theater. The kitchen looks out to a dining room, which can serve both for daily meals and to hold formal gatherings.

The primary bedroom includes a closet system and a double-vanity bathroom with a combination tub and shower.

A second bedroom, currently used as a library, also comes with a bathroom with a glass-enclosed shower.

Other details include hardwood and marble flooring that runs throughout the home. The space also features a central HVAC system, as well as a washer and dryer.

The pet-friendly building is staffed with 24-hour door attendants, porters, and a live-in superintendent.

The location is convenient to dining and shopping at the Oculus, Eataly, and the redesigned South Street Seaport.

For those with offices in the Financial District, that’s in the neighborhood, too. Subway lines converge at Fulton Center, and there’s also quick access to Citi Bike, and the PATH train at the World Trade Center station. 


Origination: https://www.realtor.com/news/unique-homes/penthouse-on-one-of-nycs-oldest-skyscrapers-on-the-market-for-2m/ 


CategoriesNews

Average Rent in Philadelphia & Rent Price Trends

Considering moving to Philadelphia? Before you start apartment hunting, learn about the local rental market. Make sure you know the average rent in Philadelphia to get your budget started!

Average Rent in Philadelphia

  • The average rent for a Philadelphia studio apartment is $1,415
  • The average rent for a Philadelphia 1-bedroom apartment is $1,721
  • The average rent for a Philadelphia 2-bedroom apartment is $2,042
  • The average rent for a Philadelphia 3-bedroom apartment is $2,059

Interested in starting your Philadelphia apartment search, here’s how to find an apartment in Philadelphia

Philadelphia Rent Trends: Rent Growth

Philadelphia rents have increased by 1.26% compared to last month, and are up by 2.83% compared to last year.

For a broader discussion of rent changes across the country, check out our National Rent Report. You can download the raw data containing rent estimates for hundreds of cities across the country.

Philadelphia Rent Trends: Inventory by Average Apartment Rent

  • 19% of apartments in Philadelphia are studio apartments.
  • 42% of apartments in Philadelphia are 1-bedroom apartments.
  • 25% of apartments in Philadelphia are 2-bedroom apartments.
  • 14% of apartments in Philadelphia are 3-bedroom apartments.

Average Rent in Philadelphia Neighborhoods

Has your ideal Philadelphia neighborhood already been picked out? Rent prices across neighborhoods can vary, so get familiar with the average rent prices across the various neighborhoods in Philadelphia.

  • The most expensive neighborhoods in Philadelphia are University City ($2,487), Center City West ($2,204), and Rittenhouse Square ($2,086).
  • The most affordable neighborhoods in Philadelphia are Washington Square West ($1,489), Brewerytown ($1,484), and Harrowgate ($1,246).

What Salary Do You Need to Live in Philadelphia?

Using the 30% rule, we can give a rough estimate of the salary needed to rent an apartment in Philadelphia. If these numbers look high, remember that a roommate or two can drastically cut down your monthly rent!

  • If you are renting an average-priced studio apartment in Philadelphia, your annual salary should be around $50,940 or higher.
  • If you are renting an average-priced 1-bedroom apartment in Philadelphia, your annual salary should be around $61,956 or higher.
  • If you are renting an average-priced 2-bedroom apartment in Philadelphia, your annual salary should be around $73,512 or higher.
  • If you are renting an average-priced 3-bedroom apartment in Philadelphia, your annual salary should be around $74,124 or higher.

If you’re considering renting in Philadelphia, be sure to learn more about the cost of living in Philadelphia.

Having trouble deciding how much rent you can afford? Try using a rent calculator.

Origination: https://www.apartmentlist.com/renter-life/average-rent-in-philadelphia